All the runs are performed on the CS205 cluster at Harvard SEAS.
Physical performance
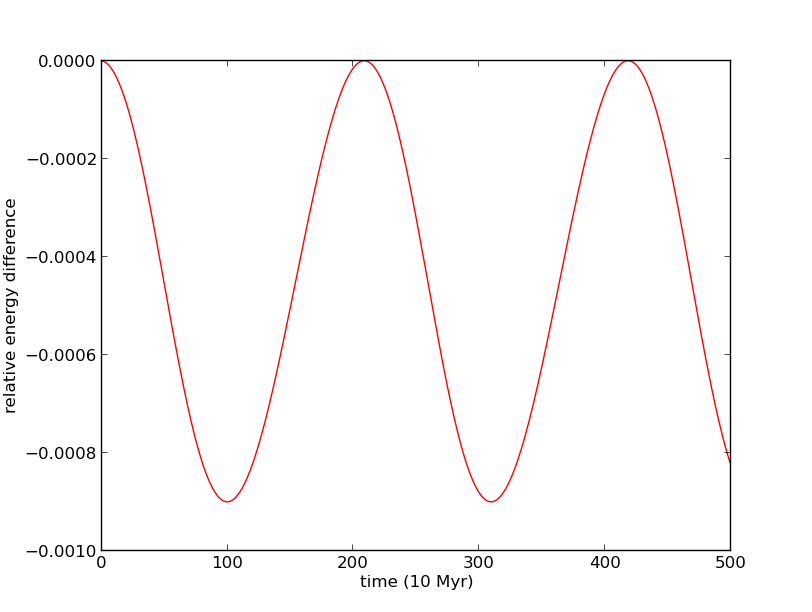
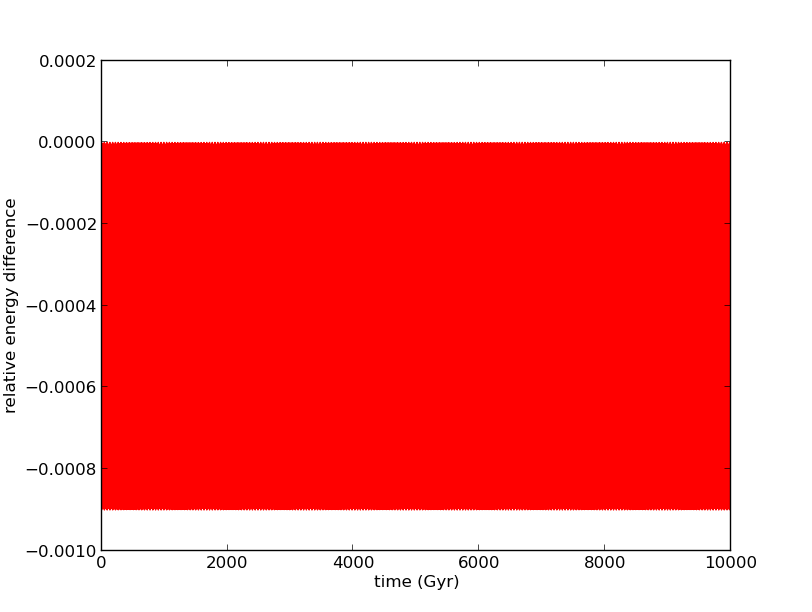
To test that our simulation is working correctly, we use energy conservation as a diagnostic. First, we use a two body problem, with two solar mass stars in an orbit with semi-major axis of 10 parsecs. We use time steps of 10 Myr, to be of order one hundredth of the period of the system. On the top plot, we see that the leapfrog energy oscillates about the true energy of the system, with error of one part in one thousand, and the same period as the binary, 2096 Myr. On the bottom plot, we see that this behaviour continues for about 5000 orbits of the system.
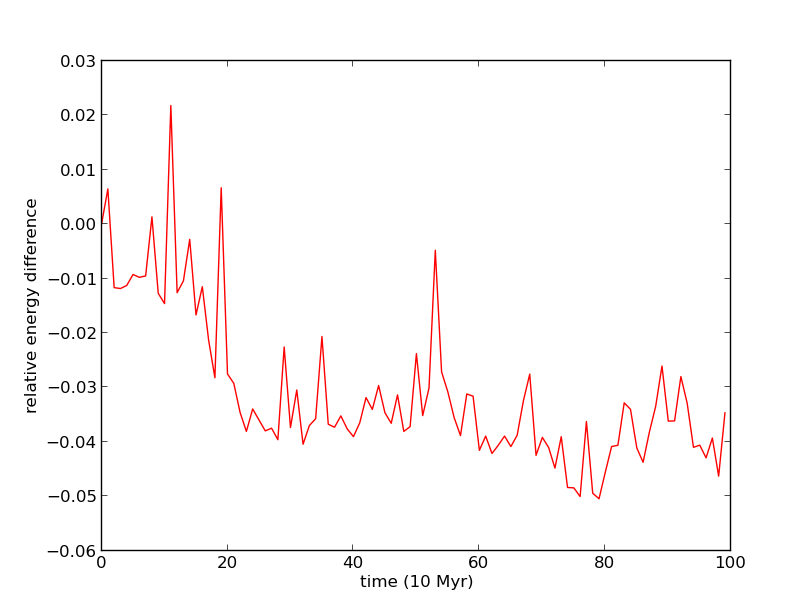
Then, we consider a four body problem, to make sure that the tree construction and leapfrog is resolving many body forces correctly, not just two body. We have an inner binary of solar mass stars with separation 2 parsecs, and an outer binary with separation 60 parsecs that orbits the inner binary. The system is unstable to perturbations, so we expect numerical errors to eventually disrupt the system. The inner binary has period 66.29 Myr, so we choose a step size of 0.5 Myr, again one hundredth of the period. The system is stable for over 100 orbits, with energy error of one part in one thousand again.
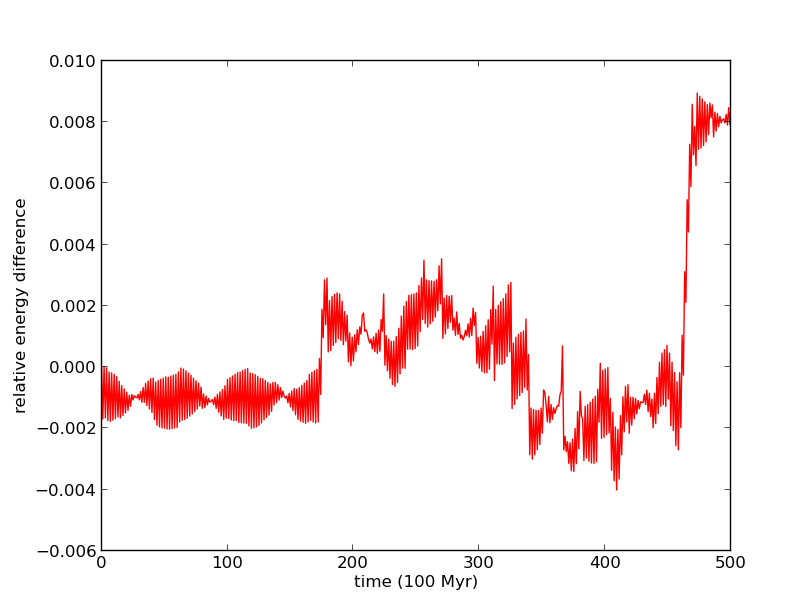
Finally, we consider a Plummer sphere cluster of 100 solar mass stars with scale radius 10 parsecs. The dynamical time of the system to collapse is 96.6 Myr, and we choose a time step 0.01 Myr, one ten-thousandth the dynamical time. Since we are restricted to constant time stepping, false scatterings can occur when particles get close to each other: the large force multiplied by a (relatively) large time step create a false scattering that would not happen under a smaller time step. To counteract these effect, we introduce solid-sphere softening (Dyer and Ip 1993, The Astrophysical Journal, 409, 1), which sacrifices the resolution of these close encounters in order to conserve energy. We find that we must introduce softening of order 1 parsec (one tenth the scale radius) to keep energy conservation up to 5% for 10 dynamical times.
Adaptive time stepping would allow large time steps when the particles are well separated, and force small time steps when close encounters need to be resolved. These time steps can be added to leapfrog N-body simulations with methods like in Quinn, et al. (1997) (http://arxiv.org/abs/astro–ph/9710043)
Computational performance
To analyze the performance, we run the two parallelized code versions for N = 100 particles on an increasing number of processes.
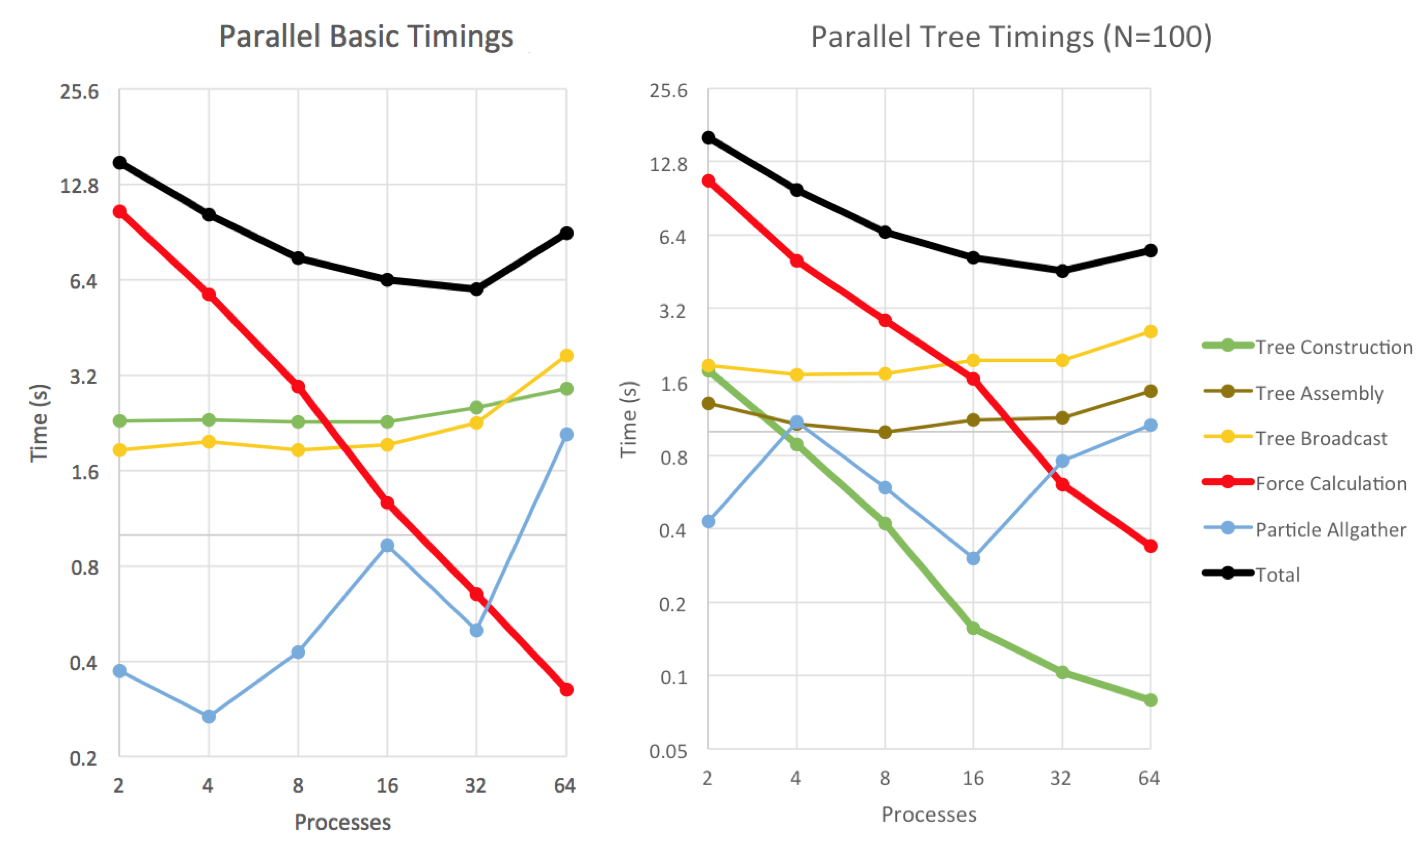
As expected, the force computation time behaves as a power-law P-1. When the tree construction parallelization is introduced in Parallel Tree, the tree construction time changes from being constant to also decreasing with the number of processes as a power-law P-1.
The broadcast is expected to scale with log P. Parallel Basic’s Particle Gather and Parallel Tree’s Tree Assembly steps, involve a gather to the home process and Parallel Tree’s last step is an allgather; gather and allgather scale with with log P if latency dominates or with message size if bandwidth is the limiting factor. It is not clear what functional form the communication steps follow in our data; also, the times are complicated by the fact that once the number of processors on a single node is exceeded, we have to contend with internode communication. The gather timing values are unstable in part because of their small magnitudes – variations in the network look large on the log scale.
To check the code behavior for a larger number of particles, we repeat the analysis for N = 1000.
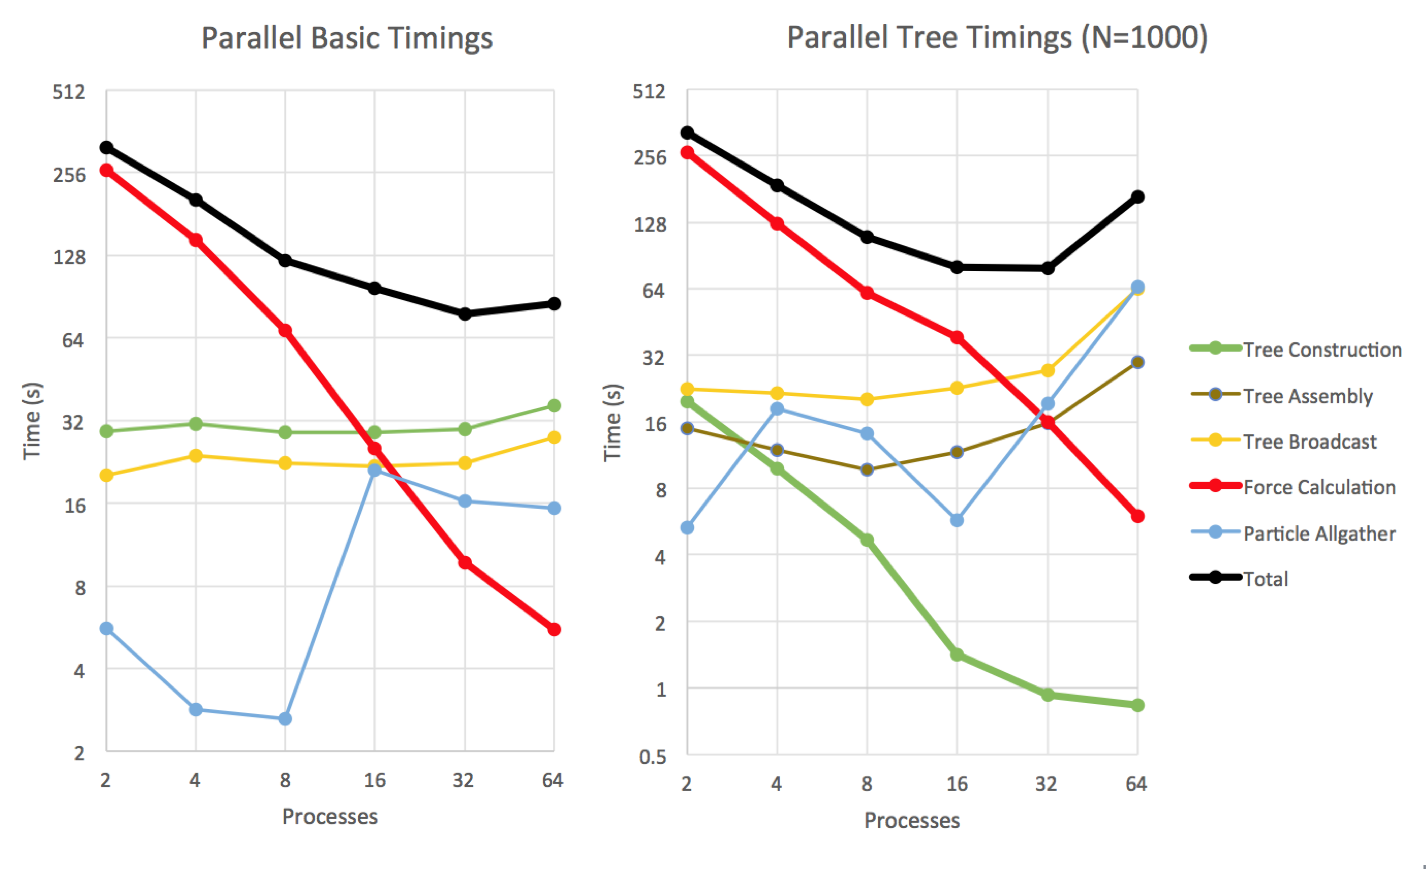
Again here we observe the P-1 decrease in force computation time, and the tree construction time change from constant to P-1 in the Parallel Tree method. The communication times are up by roughly a factor of 10 compared to the N = 100 case, suggesting that the increased message size (from the increased number of particles) dominates, rather than latency. This time however, for N = 1000 the various sources of communication overhead start increasing for number of processes above 16, perhaps because we are starting to use internode communication. This overhead becomes quite strong and causes the total time to increase with the number of processes.
We carry out a speedup and efficiency analysis for these runs.
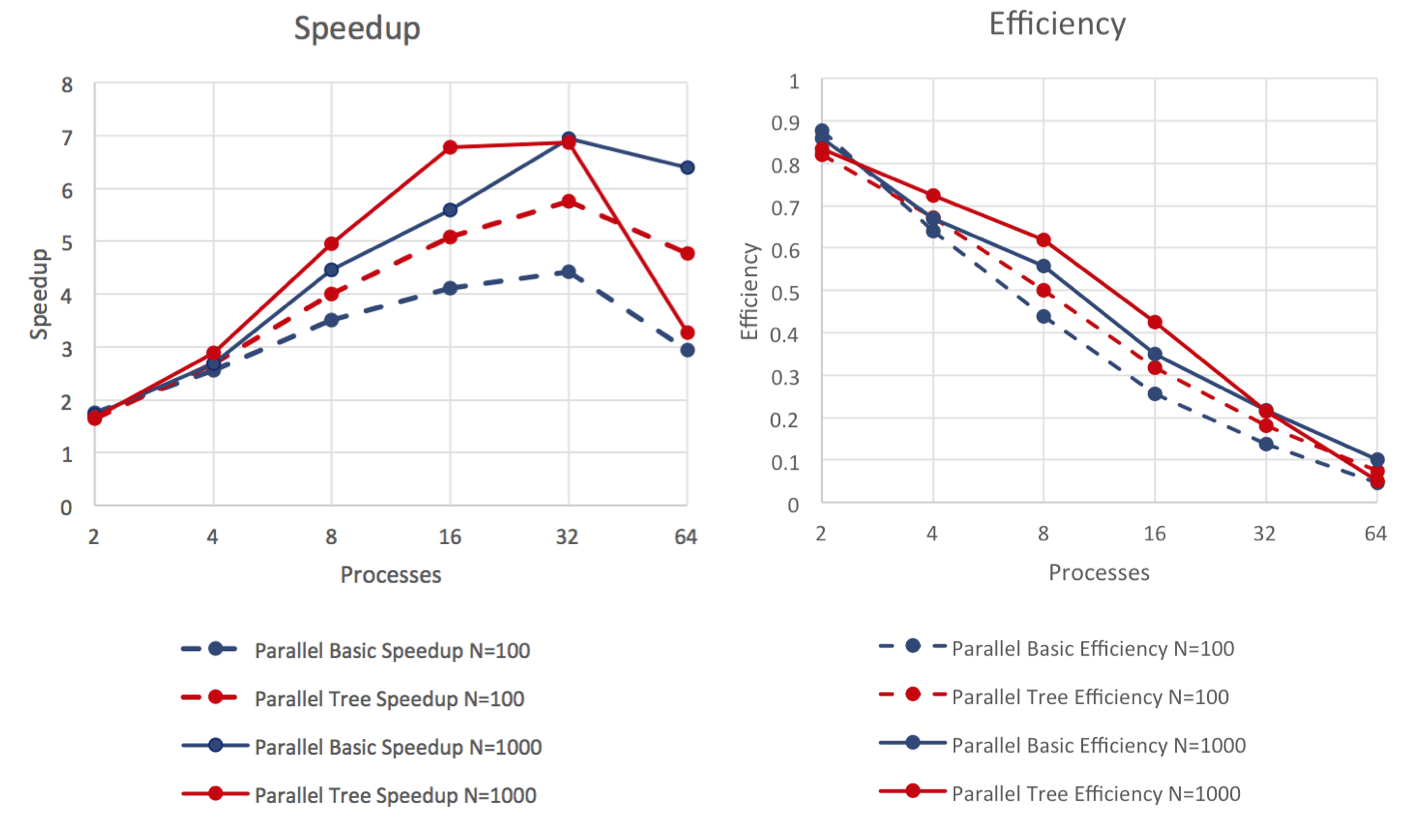
The speedup peaks for a number of processes around 16 or 32, with the most drastic loss of speedup and efficiency occurring for N = 1000 going from 32 to 64 processes. As can be seen in the timing graphs above, this occurs due to increased communication overhead.
The efficiency and speedup are expected to be better in the N = 1000 case because the number of computations scales as N log N, while the communication scales as N, so as the number of particles increases the computations to overhead ratio increases as well. The overall trend of worsening efficiency as the number of processes increases is due to the fact that we always broadcast the full tree / gather all the particles. Then the communication time stays constant or increases with log P, leading to a parallel overhead of P or P log P, decreasing efficiency with more processes.
A better implementation would need to address this issue. One idea to reduce communication is having each process keep its local tree to itself, and have processes request only the parts of the tree that they need from other processes. Such implementations have been created by Warren and Salmon (Proceedings of the 1993 ACM/IEEE conference on Supercomputing, pp. 12-21) and Grama, Kumar, and Sameh (Proceedings of the 1994 ACM/IEEE conference on Supercomputing, pp. 439-448). Instead of distributing the domains evenly as we do, a Peano-Hilbert curve can be used to create subdomains that have minimal surface area and still contain equal load.